


Census Tract 58.27, Clark County, Nevada
About
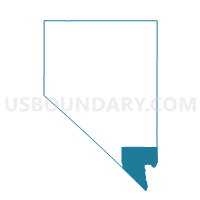
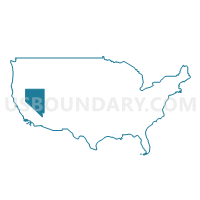
Outline

Summary
| Unique Area Identifier | 471429 |
| Name | Census Tract 58.27 |
| County | Clark County |
| State | Nevada |
| Area (square miles) | 548.32 |
| Land Area (square miles) | 548.32 |
| Water Area (square miles) | 0.00 |
| % of Land Area | 100.00 |
| % of Water Area | 0.00 |
| Latitude of the Internal Point | 35.88627500 |
| Longtitude of the Internal Point | -115.51132990 |
| Total Population | 6,125 |
| Total Housing Units | 2,652 |
| Total Households | 2,212 |
| Median Age | 35.6 |
Maps

Graphs
Select a template below for downloading or customizing gragh for Census Tract 58.27, Clark County, Nevada


Neighbors
Neighoring Census Tract (by Name) Neighboring Census Tract on the Map
- Census Tract 103, San Bernardino County, CA
- Census Tract 57.03, Clark County, NV
- Census Tract 57.11, Clark County, NV
- Census Tract 58.28, Clark County, NV
- Census Tract 58.29, Clark County, NV
- Census Tract 58.30, Clark County, NV
- Census Tract 58.31, Clark County, NV
- Census Tract 58.32, Clark County, NV
- Census Tract 58.33, Clark County, NV
- Census Tract 58.39, Clark County, NV
- Census Tract 58.40, Clark County, NV
- Census Tract 75, Clark County, NV
- Census Tract 8, Inyo County, CA
- Census Tract 9604.06, Nye County, NV
Top 10 Neighboring County Subdivision (by Population) Neighboring County Subdivision on the Map
- Clark CCD, Clark County, NV (179,324)
- Pahrump CCD, Nye County, NV (36,583)
- Newberry Springs-Baker CCD, San Bernardino County, CA (12,696)
- Death Valley CCD, Inyo County, CA (765)
Top 10 Neighboring Place (by Population) Neighboring Place on the Map
- Enterprise CDP, NV (108,481)
- Sandy Valley CDP, NV (2,051)
- Blue Diamond CDP, NV (290)
- Goodsprings CDP, NV (229)
Top 10 Neighboring Unified School District (by Population) Neighboring Unified School District on the Map
- Clark County School District, NV (1,951,269)
- Nye County School District, NV (43,946)
- Baker Valley Unified School District, CA (973)
- Death Valley Unified School District, CA (765)
Top 10 Neighboring State Legislative District Lower Chamber (by Population) Neighboring State Legislative District Lower Chamber on the Map
- Assembly District 34, CA (487,193)
- Assembly District 13, NV (256,407)
- Assembly District 22, NV (222,912)
- Assembly District 36, NV (59,012)
- Assembly District 20, NV (58,569)
Top 10 Neighboring State Legislative District Upper Chamber (by Population) Neighboring State Legislative District Upper Chamber on the Map
- State Senate District 18, CA (1,048,811)
- Clark County Senatorial District 9, NV (354,064)
- Clark County Senatorial District 12, NV (214,362)
- Central Nevada Senatorial District, NV (113,138)
Top 10 Neighboring 111th Congressional District (by Population) Neighboring 111th Congressional District on the Map
- Congressional District 3, NV (1,043,855)
- Congressional District 25, CA (844,320)
- Congressional District 2, NV (836,562)
Top 10 Neighboring 5-Digit ZIP Code Tabulation Area (by Population) Neighboring 5-Digit ZIP Code Tabulation Area on the Map
- 89148, NV (39,712)
- 89178, NV (27,588)
- 89141, NV (25,150)
- 89135, NV (24,144)
- 89044, NV (14,260)
- 89061, NV (5,252)
- 89019, NV (2,673)
- 89179, NV (2,340)
- 89124, NV (941)
- 89004, NV (313)
Data
Demographic, Population, Households, and Housing Units
** Data sources from census 2010 **
Show Data on Map
Download Full List as CSV
Download Quick Sheet as CSV
| Subject | This Area | Clark County | Nevada | National |
|---|---|---|---|---|
| POPULATION | ||||
| Total Population Map | 6,125 | 1,951,269 | 2,700,551 | 308,745,538 |
| POPULATION, HISPANIC OR LATINO ORIGIN | ||||
| Not Hispanic or Latino Map | 5,249 | 1,382,625 | 1,984,050 | 258,267,944 |
| Hispanic or Latino Map | 876 | 568,644 | 716,501 | 50,477,594 |
| POPULATION, RACE | ||||
| White alone Map | 4,052 | 1,188,112 | 1,786,688 | 223,553,265 |
| Black or African American alone Map | 257 | 204,379 | 218,626 | 38,929,319 |
| American Indian and Alaska Native alone Map | 36 | 14,422 | 32,062 | 2,932,248 |
| Asian alone Map | 1,056 | 168,831 | 195,436 | 14,674,252 |
| Native Hawaiian and Other Pacific Islander alone Map | 35 | 13,628 | 16,871 | 540,013 |
| Some Other Race alone Map | 362 | 262,506 | 324,793 | 19,107,368 |
| Two or More Races Map | 327 | 99,391 | 126,075 | 9,009,073 |
| POPULATION, SEX | ||||
| Male Map | 3,094 | 982,193 | 1,363,616 | 151,781,326 |
| Female Map | 3,031 | 969,076 | 1,336,935 | 156,964,212 |
| POPULATION, AGE (18 YEARS) | ||||
| 18 years and over Map | 4,583 | 1,462,651 | 2,035,543 | 234,564,071 |
| Under 18 years | 1,542 | 488,618 | 665,008 | 74,181,467 |
| POPULATION, AGE | ||||
| Under 5 years | 518 | 138,982 | 187,478 | 20,201,362 |
| 5 to 9 years | 425 | 135,411 | 183,077 | 20,348,657 |
| 10 to 14 years | 386 | 133,660 | 183,173 | 20,677,194 |
| 15 to 17 years | 213 | 80,565 | 111,280 | 12,954,254 |
| 18 and 19 years | 113 | 50,875 | 71,320 | 9,086,089 |
| 20 years | 56 | 25,309 | 35,554 | 4,519,129 |
| 21 years | 40 | 24,504 | 34,258 | 4,354,294 |
| 22 to 24 years | 176 | 78,432 | 107,697 | 12,712,576 |
| 25 to 29 years | 482 | 148,694 | 196,644 | 21,101,849 |
| 30 to 34 years | 606 | 145,831 | 190,642 | 19,962,099 |
| 35 to 39 years | 458 | 146,476 | 191,652 | 20,179,642 |
| 40 to 44 years | 453 | 142,010 | 191,391 | 20,890,964 |
| 45 to 49 years | 435 | 138,281 | 193,790 | 22,708,591 |
| 50 to 54 years | 470 | 126,532 | 182,737 | 22,298,125 |
| 55 to 59 years | 382 | 112,302 | 164,575 | 19,664,805 |
| 60 and 61 years | 161 | 42,710 | 62,389 | 7,113,727 |
| 62 to 64 years | 183 | 60,250 | 88,535 | 9,704,197 |
| 65 and 66 years | 108 | 33,605 | 49,613 | 5,319,902 |
| 67 to 69 years | 119 | 44,911 | 65,888 | 7,115,361 |
| 70 to 74 years | 152 | 56,387 | 82,280 | 9,278,166 |
| 75 to 79 years | 112 | 39,492 | 57,503 | 7,317,795 |
| 80 to 84 years | 43 | 26,366 | 38,888 | 5,743,327 |
| 85 years and over | 34 | 19,684 | 30,187 | 5,493,433 |
| MEDIAN AGE BY SEX | ||||
| Both sexes Map | 35.60 | 35.50 | 36.30 | 37.20 |
| Male Map | 36.40 | 35.00 | 35.80 | 35.80 |
| Female Map | 34.90 | 36.00 | 36.90 | 38.50 |
| HOUSEHOLDS | ||||
| Total Households Map | 2,212 | 715,365 | 1,006,250 | 116,716,292 |
| HOUSEHOLDS, HOUSEHOLD TYPE | ||||
| Family households: Map | 1,539 | 467,916 | 656,621 | 77,538,296 |
| Husband-wife family Map | 1,230 | 321,717 | 462,509 | 56,510,377 |
| Other family: Map | 309 | 146,199 | 194,112 | 21,027,919 |
| Male householder, no wife present Map | 120 | 49,570 | 66,525 | 5,777,570 |
| Female householder, no husband present Map | 189 | 96,629 | 127,587 | 15,250,349 |
| Nonfamily households: Map | 673 | 247,449 | 349,629 | 39,177,996 |
| Householder living alone Map | 434 | 181,030 | 258,409 | 31,204,909 |
| Householder not living alone Map | 239 | 66,419 | 91,220 | 7,973,087 |
| HOUSEHOLDS, HISPANIC OR LATINO ORIGIN OF HOUSEHOLDER | ||||
| Not Hispanic or Latino householder: Map | 2,010 | 568,032 | 820,824 | 103,254,926 |
| Hispanic or Latino householder: Map | 202 | 147,333 | 185,426 | 13,461,366 |
| HOUSEHOLDS, RACE OF HOUSEHOLDER | ||||
| Householder who is White alone | 1,629 | 482,734 | 730,548 | 89,754,352 |
| Householder who is Black or African American alone | 92 | 76,780 | 81,599 | 14,129,983 |
| Householder who is American Indian and Alaska Native alone | 15 | 4,920 | 11,237 | 939,707 |
| Householder who is Asian alone | 311 | 55,981 | 64,558 | 4,632,164 |
| Householder who is Native Hawaiian and Other Pacific Islander alone | 8 | 4,059 | 4,964 | 143,932 |
| Householder who is Some Other Race alone | 82 | 67,332 | 83,261 | 4,916,427 |
| Householder who is Two or More Races | 75 | 23,559 | 30,083 | 2,199,727 |
| HOUSEHOLDS, HOUSEHOLD TYPE BY HOUSEHOLD SIZE | ||||
| Family households: Map | 1,539 | 467,916 | 656,621 | 77,538,296 |
| 2-person household Map | 576 | 175,802 | 259,433 | 31,882,616 |
| 3-person household Map | 364 | 105,287 | 145,699 | 17,765,829 |
| 4-person household Map | 298 | 90,043 | 124,486 | 15,214,075 |
| 5-person household Map | 172 | 51,995 | 69,451 | 7,411,997 |
| 6-person household Map | 81 | 24,853 | 32,318 | 3,026,278 |
| 7-or-more-person household Map | 48 | 19,936 | 25,234 | 2,237,501 |
| Nonfamily households: Map | 673 | 247,449 | 349,629 | 39,177,996 |
| 1-person household Map | 434 | 181,030 | 258,409 | 31,204,909 |
| 2-person household Map | 207 | 53,453 | 73,314 | 6,360,012 |
| 3-person household Map | 19 | 8,533 | 11,737 | 992,156 |
| 4-person household Map | 7 | 2,927 | 4,131 | 411,171 |
| 5-person household Map | 4 | 924 | 1,258 | 126,634 |
| 6-person household Map | 0 | 340 | 440 | 48,421 |
| 7-or-more-person household Map | 2 | 242 | 340 | 34,693 |
| HOUSING UNITS | ||||
| Total Housing Units Map | 2,652 | 840,343 | 1,173,814 | 131,704,730 |
| HOUSING UNITS, OCCUPANCY STATUS | ||||
| Occupied Map | 2,212 | 715,365 | 1,006,250 | 116,716,292 |
| Vacant Map | 440 | 124,978 | 167,564 | 14,988,438 |
| HOUSING UNITS, OCCUPIED, TENURE | ||||
| Owned with a mortgage or a loan Map | 1,401 | 333,552 | 465,029 | 52,979,430 |
| Owned free and clear Map | 334 | 74,654 | 126,451 | 23,006,644 |
| Renter occupied Map | 477 | 307,159 | 414,770 | 40,730,218 |
| HOUSING UNITS, VACANT, VACANCY STATUS | ||||
| For rent Map | 24 | 47,504 | 61,985 | 4,137,567 |
| Rented, not occupied Map | 4 | 1,291 | 1,838 | 206,825 |
| For sale only Map | 114 | 26,963 | 32,949 | 1,896,796 |
| Sold, not occupied Map | 14 | 2,277 | 3,416 | 421,032 |
| For seasonal, recreational, or occasional use Map | 105 | 22,002 | 32,703 | 4,649,298 |
| For migrant workers Map | 0 | 45 | 242 | 24,161 |
| Other vacant Map | 179 | 24,896 | 34,431 | 3,652,759 |
| HOUSING UNITS, OCCUPIED, AVERAGE HOUSEHOLD SIZE BY TENURE | ||||
| Total: Map | 2.77 | 2.70 | 2.65 | 2.58 |
| Owner occupied Map | 2.74 | 2.71 | 2.66 | 2.65 |
| Renter occupied Map | 2.88 | 2.67 | 2.63 | 2.44 |
| HOUSING UNITS, OCCUPIED, TENURE BY RACE OF HOUSEHOLDER | ||||
| Owner occupied: Map | 1,735 | 408,206 | 591,480 | 75,986,074 |
| Householder who is White alone Map | 1,279 | 303,371 | 465,605 | 63,446,275 |
| Householder who is Black or African American alone Map | 61 | 26,883 | 28,560 | 6,261,464 |
| Householder who is American Indian and Alaska Native alone Map | 11 | 2,243 | 5,842 | 509,588 |
| Householder who is Asian alone Map | 268 | 35,354 | 40,436 | 2,688,861 |
| Householder who is Native Hawaiian and Other Pacific Islander alone Map | 5 | 1,556 | 1,890 | 61,911 |
| Householder who is Some Other Race alone Map | 59 | 27,864 | 35,072 | 1,975,817 |
| Householder who is Two or More Races Map | 52 | 10,935 | 14,075 | 1,042,158 |
| Renter occupied: Map | 477 | 307,159 | 414,770 | 40,730,218 |
| Householder who is White alone Map | 350 | 179,363 | 264,943 | 26,308,077 |
| Householder who is Black or African American alone Map | 31 | 49,897 | 53,039 | 7,868,519 |
| Householder who is American Indian and Alaska Native alone Map | 4 | 2,677 | 5,395 | 430,119 |
| Householder who is Asian alone Map | 43 | 20,627 | 24,122 | 1,943,303 |
| Householder who is Native Hawaiian and Other Pacific Islander alone Map | 3 | 2,503 | 3,074 | 82,021 |
| Householder who is Some Other Race alone Map | 23 | 39,468 | 48,189 | 2,940,610 |
| Householder who is Two or More Races Map | 23 | 12,624 | 16,008 | 1,157,569 |
| HOUSING UNITS, OCCUPIED, TENURE BY HISPANIC OR LATINO ORIGIN OF HOUSEHOLDER | ||||
| Owner occupied: Map | 1,735 | 408,206 | 591,480 | 75,986,074 |
| Not Hispanic or Latino householder Map | 1,593 | 340,151 | 505,161 | 69,617,625 |
| Hispanic or Latino householder Map | 142 | 68,055 | 86,319 | 6,368,449 |
| Renter occupied: Map | 477 | 307,159 | 414,770 | 40,730,218 |
| Not Hispanic or Latino householder Map | 417 | 227,881 | 315,663 | 33,637,301 |
| Hispanic or Latino householder Map | 60 | 79,278 | 99,107 | 7,092,917 |
| HOUSING UNITS, OCCUPIED, TENURE BY HOUSEHOLD SIZE | ||||
| Owner occupied: Map | 1,735 | 408,206 | 591,480 | 75,986,074 |
| 1-person household Map | 315 | 88,005 | 128,770 | 16,453,569 |
| 2-person household Map | 666 | 147,174 | 221,534 | 27,618,605 |
| 3-person household Map | 297 | 65,223 | 92,417 | 12,517,563 |
| 4-person household Map | 236 | 54,212 | 77,088 | 10,998,793 |
| 5-person household Map | 130 | 29,394 | 39,969 | 5,057,765 |
| 6-person household Map | 51 | 13,612 | 18,011 | 1,965,796 |
| 7-or-more-person household Map | 40 | 10,586 | 13,691 | 1,373,983 |
| Renter occupied: Map | 477 | 307,159 | 414,770 | 40,730,218 |
| 1-person household Map | 119 | 93,025 | 129,639 | 14,751,340 |
| 2-person household Map | 117 | 82,081 | 111,213 | 10,624,023 |
| 3-person household Map | 86 | 48,597 | 65,019 | 6,240,422 |
| 4-person household Map | 69 | 38,758 | 51,529 | 4,626,453 |
| 5-person household Map | 46 | 23,525 | 30,740 | 2,480,866 |
| 6-person household Map | 30 | 11,581 | 14,747 | 1,108,903 |
| 7-or-more-person household Map | 10 | 9,592 | 11,883 | 898,211 |
Loading...